Research
How Fast Can A1C Actually Change? What 30, 60 and 90 Days Really Mean
A1C reflects roughly two to three months of glucose exposure, but it doesn't wait 90 days to move. Recent glucose counts for more, so change can show up within weeks.
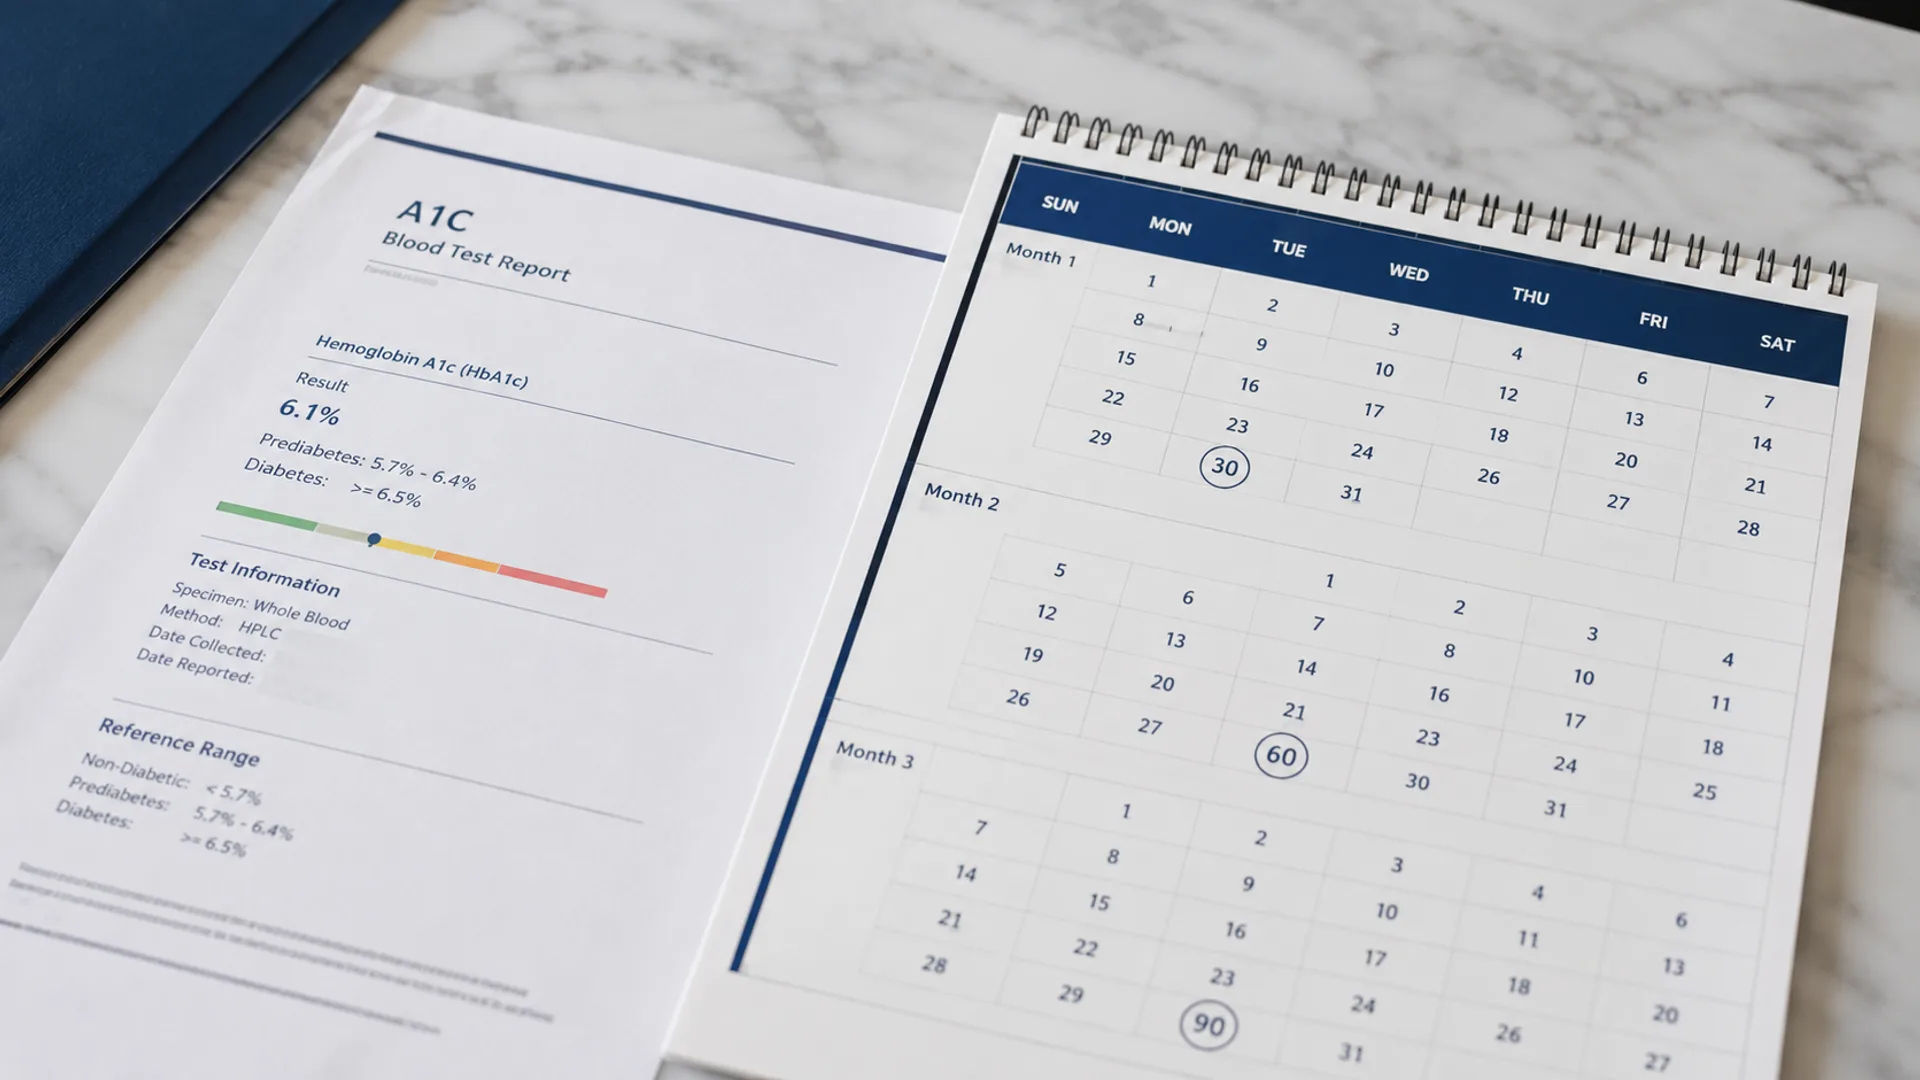
You get an A1C result you don't like.
So you change your diet.
Start walking.
Take your medication consistently.
Maybe your glucose readings start improving almost immediately.
Then comes the obvious question:
How long until my A1C actually shows it?
You've probably heard:
"A1C takes three months to change."
That's not quite right.
A1C reflects roughly the previous two to three months of glucose exposure.
But that does not mean your A1C stays frozen for 90 days and suddenly changes on day 91.
It starts responding much sooner.
In fact, clinically meaningful changes can sometimes be detected within:
a few weeks.
The reason comes down to how A1C is created.
A1C is being formed every day
Red blood cells contain a protein called:
hemoglobin.
As glucose circulates through your blood, some of it attaches to hemoglobin through a process called glycation.
The more glucose those red blood cells are exposed to over time, the more glycated hemoglobin accumulates.
That's what the A1C test measures.
Red blood cells circulate for roughly:
120 days
on average.
But your bloodstream isn't filled with red blood cells that were all born on the same day.
At any moment, you have a mixture of:
- very young red blood cells
- middle-aged red blood cells
- older red blood cells approaching the end of their lifespan
New cells are constantly entering circulation.
Old cells are constantly being removed.
That means A1C is constantly updating too.
The most recent month matters more than the oldest month
This is one of the most important things to understand about A1C.
It is not a simple 90-day average where every day receives exactly the same weight.
Recent glucose exposure contributes more heavily to the final result.
The 2026 American Diabetes Association Standards describe A1C as a:
weighted average
that is more heavily influenced by recent blood glucose.
Older kinetic studies and mathematical models estimated that glucose during roughly the:
most recent 30 days may contribute about half of the final A1C result.
By comparison, glucose exposure from roughly 90–120 days earlier contributes much less.
That doesn't mean everybody's A1C can be mathematically divided into exact monthly percentages.
Red-cell lifespan differs between people.
But the principle is well established:
Yesterday matters more to today's A1C than three months ago does.
That is why the number can move sooner than people expect.
A classic study measured the change week by week
Researchers studied people with newly diagnosed type 2 diabetes whose high glucose was rapidly improved.
Their fasting glucose normalized relatively quickly.
Then researchers watched how several glycemic markers responded.
A1C did not wait three months to start falling.
It declined substantially during the first several weeks.
The estimated half-time of the A1C response was approximately:
34.6 days.
That means when glucose suddenly improved and stayed improved, roughly half of the eventual A1C adjustment occurred in a little over one month.
The decrease continued after that, but more gradually.
That's a much better mental model than:
Nothing happens for 90 days.
Another study measured A1C at 2, 4, 8 and 12 weeks
Researchers later asked a very practical question:
How soon after changing diabetes treatment can A1C tell us whether things are improving?
They followed adults with type 2 diabetes who had started or increased glucose-lowering medication.
A1C was measured at:
- baseline
- 2 weeks
- 4 weeks
- 8 weeks
- 12 weeks
Among the participants who completed follow-up without another medication change, average A1C was:
Start
8.7%
2 weeks
8.6%
4 weeks
8.4%
8 weeks
8.2%
12 weeks
8.1%
So by:
30 days
the average A1C had already fallen approximately:
0.3 percentage points.
By:
60 days
it had fallen around:
0.5 points.
And by approximately:
90 days
the average reduction reached:
0.6 points.
These are averages from one particular group after medication changes.
They are not a prediction of how fast your A1C should fall.
But they demonstrate something clearly:
A1C can change well before three months have passed.
What 30 days actually tells you
Suppose you make a major change today and maintain significantly better glucose for the next month.
At:
30 days
your A1C may already be meaningfully lower.
But it will still contain substantial information from the period before you changed anything.
Imagine:
Previous months
Average glucose was high.
Last 30 days
Average glucose improved dramatically.
Your current A1C becomes a mixture of:
the older high-glucose period
and:
the newer improved period.
So if the number hasn't reached your eventual goal yet after one month, that doesn't necessarily mean the changes aren't working.
Some of the old exposure is still represented in the test.
This creates an important 30-day mistake
Imagine someone starts with:
A1C 9.0%.
They make substantial changes.
A month later, their daily glucose readings look dramatically better.
They repeat A1C and see:
8.3%.
They think:
"I'm still at 8.3. This isn't working."
But that's the wrong interpretation.
The better question is:
Where did I start, where are my current glucose readings, and what direction is A1C moving?
If current glucose has improved substantially, the A1C may simply be catching up.
One month is enough to see direction.
It is not necessarily enough to see the full result.
What 60 days tells you
By roughly:
two months
much more of the A1C result reflects your newer glucose environment.
That is why the 12-week medication study found something interesting.
The change in A1C at:
8 weeks
was already strongly correlated with the eventual change at:
12 weeks.
In that study, researchers could use the 8-week result to identify participants who were unlikely to reach the study's glycemic target by week 12.
So:
60 days can give you a pretty strong preview of where things are heading.
It still isn't necessarily the final steady-state result.
But it is far more informative than many people assume.
What 90 days tells you
Around:
three months
most of the glucose exposure represented by your A1C occurred after the change.
That's one reason diabetes care has traditionally used approximately three-month intervals after:
- treatment changes
- significant lifestyle changes
- unstable glucose control
The 2026 ADA Standards recommend assessing A1C or other glycemic measures more frequently — commonly around:
every three months
for people:
- not meeting glycemic targets
- who recently changed treatment
- experiencing significant hyperglycemia or hypoglycemia
- whose health status has changed
At 90 days, you generally have a much clearer picture of whether a new pattern has actually been established.
But 90 days still isn't a magic biological reset
Even at three months, A1C is not a perfect record.
Red-cell lifespan varies.
Some red cells survive beyond three months.
And A1C itself has both:
- biological variability
- measurement variability
So don't think of day 90 as:
Everything before this date has disappeared.
Think of it as:
The great majority of the signal now reflects the newer glucose environment.
That's why three months is clinically useful.
It isn't because the body runs on an exact 90-day timer.
Why a great week before the test won't completely rescue your A1C
This also explains why trying to:
"cram for the A1C test"
doesn't work particularly well.
Suppose someone eats very differently for:
7 days
before their blood test.
Their glucose may improve immediately.
And because recent glucose is weighted more heavily, that week can influence the result somewhat.
But it cannot erase:
months of higher glucose exposure.
A1C is specifically useful because it is much harder to manipulate with one unusually good day than a fasting glucose test.
A fasting glucose tells you:
What is happening now?
A1C asks something closer to:
What has usually been happening?
The opposite is true too
Suppose you've had excellent glucose control for three months.
Then the night before your A1C test:
- you have a stressful evening
- sleep terribly
- eat a large meal
- wake with unexpectedly high glucose
That one reading does not suddenly destroy three months of progress.
The 2026 ADA Standards specifically note that A1C is less affected than an individual glucose measurement by acute factors such as:
- recent food intake
- stress
- illness
- physical activity
That's part of why clinicians use it.
How much can A1C fall in three months?
There is no universal answer.
It depends heavily on:
where you start
and:
how much average glucose actually changes.
Someone starting with:
A1C 11%
has much more room for a dramatic drop than someone starting at:
6.4%.
Large reductions can occur when previously high glucose falls substantially and stays lower.
Medications can also have very different glucose-lowering effects.
So claims such as:
"Everyone can lower A1C by 2 points in 90 days"
aren't scientifically responsible.
The result depends on:
- baseline A1C
- medication
- nutrition
- activity
- weight change
- insulin sensitivity
- insulin production
- illness
- adherence
- individual biology
What matters is not chasing an arbitrary speed.
It's establishing a lower glucose pattern and maintaining it.
Your glucose can improve before your A1C catches up
This distinction is particularly important when someone has access to:
- a glucose meter
- continuous glucose monitoring
Imagine your previous average glucose was:
200 mg/dL.
Then after a major treatment change, your recent readings are averaging closer to:
125 mg/dL.
Your A1C today may still look substantially higher than what 125 mg/dL would eventually correspond to.
That's because the test still remembers part of the previous period.
This is not necessarily disagreement.
The measurements are looking at different time windows.
Current glucose
tells you what is happening now.
A1C
still contains information about what was happening weeks ago.
Both can be correct.
Get the research, without the noise.
Practical, sourced writing on blood sugar and metabolic health. One email a week.
One email a week. Unsubscribe any time. See our privacy policy.
CGM can show change much faster
A CGM doesn't have to wait for red blood cells to turn over.
Metrics such as:
- mean glucose
- time in range
- time above range
- time below range
respond almost immediately when glucose changes.
This makes CGM particularly useful when someone wants to know:
"Is what I'm doing working right now?"
The ADA recommends using A1C and/or CGM metrics to assess glycemic status.
The two measurements answer somewhat different questions.
A1C gives a stable longer-term view.
CGM gives far more detail about the present.
There's also a blood test that looks at a shorter window
When A1C cannot be reliably interpreted — or when a shorter-term view is useful — clinicians may sometimes use:
fructosamine
or:
glycated albumin.
Unlike hemoglobin, albumin turns over relatively quickly.
These tests generally reflect approximately:
2–4 weeks
of glycemia rather than several months.
That makes them potentially useful when glucose has changed rapidly or when red-blood-cell conditions make A1C unreliable.
But they have limitations too.
They can be affected by conditions that alter:
- albumin production
- albumin loss
- protein metabolism
And A1C remains much more established for predicting long-term diabetes complications.
So shorter does not automatically mean better.
It simply answers a different question.
Why testing A1C every week usually isn't useful
If A1C can begin changing within weeks, you might wonder:
Why not test it every week?
Because the signal moves gradually.
Small week-to-week changes can be difficult to distinguish from normal:
- biological variation
- laboratory variation
And frequent testing can encourage people to overreact to tiny changes that don't mean very much.
Current ADA guidance generally recommends:
Stable and meeting goals
A1C assessment approximately:
twice per year
may be sufficient.
Treatment recently changed or goals not met
Assessment around:
every three months
is commonly appropriate, with additional assessment when clinically needed.
The objective isn't to collect as many numbers as possible.
It's to collect numbers often enough to make useful decisions.
A better 30-60-90 day mental model
Here's a simpler way to think about the timeline.
At 30 days: direction
Your A1C can already move.
But significant influence from your previous glucose pattern remains.
Ask:
Are the daily numbers clearly moving in the right direction?
At 60 days: trajectory
A larger portion of the result now reflects your new behavior or treatment.
Your A1C can provide a much clearer preview of where you're heading.
Ask:
Is the improvement being sustained?
At 90 days: established pattern
Most of the result reflects the newer glucose environment.
You now have a much stronger measure of the overall effect.
Ask:
Did the changes produce the metabolic result we wanted?
That's far more useful than:
"Wait exactly three months and hope."
The Health Facts takeaway
A1C does not operate on a:
90-day delay.
Your glucose changes first.
Your A1C begins following it.
And because recent glucose contributes more heavily to the result, meaningful improvement can appear well before three months.
The timeline is closer to:
glucose improves today
↓
A1C begins shifting over the following weeks
↓
30 days shows direction
↓
60 days gives a stronger preview
↓
90 days gives a much fuller picture
That also means you don't need to wait three months to know whether you're moving in the right direction.
Look at:
- fasting glucose
- post-meal glucose
- CGM trends when available
- consistency of the behaviors producing those numbers
A1C will eventually reflect that new reality.
And perhaps the most important part is this:
A1C is a lagging indicator.
It tells you where your metabolism has been.
Your daily glucose tells you where it is going.
So if your current numbers have meaningfully improved but your A1C hasn't completely caught up yet...
that doesn't necessarily mean you're failing.
The older glucose is still leaving the report card.
Give the new pattern enough time to become the dominant one.
Sources
- 1. American Diabetes Association Professional Practice Committee for Diabetes. Diagnosis and Classification of Diabetes: Standards of Care in Diabetes—2026. Diabetes Care, 2026.
- 2. American Diabetes Association Professional Practice Committee for Diabetes. Glycemic Goals, Hypoglycemia, and Hyperglycemic Crises: Standards of Care in Diabetes—2026. Diabetes Care, 2026.
- 3. Hirst JA, Stevens RJ, Farmer AJ. Changes in HbA1c Level Over a 12-Week Follow-up in Patients With Type 2 Diabetes Following a Medication Change. PLOS ONE, 2014. doi:10.1371/journal.pone.0092458
- 4. Tahara Y, Shima K. Kinetics of HbA1c, Glycated Albumin, and Fructosamine and Analysis of Their Weight Functions Against Preceding Plasma Glucose Level. Diabetes Care, 1995. doi:10.2337/diacare.18.4.440
- 5. Sacks DB, et al. Guidelines and Recommendations for Laboratory Analysis in the Diagnosis and Management of Diabetes Mellitus. Diabetes Care, 2023. doi:10.2337/dci23-0036
- 6. American Diabetes Association. Tests of Glycemia in Diabetes. Diabetes Care, 2004.
- 7. Cohen RM, Franco RS, Khera PK, et al. Red Cell Life Span Heterogeneity in Hematologically Normal People Is Sufficient to Alter HbA1c. Blood, 2008. doi:10.1182/blood-2008-04-154112
Comments
No comments yet.
Leave a comment
Comments are moderated. Be kind and stay on topic.