Type 2 Diabetes
A1C Isn't the Whole Story: 7 Other Numbers Worth Watching With Type 2 Diabetes
A1C is important, but it can't tell you everything about your glucose patterns, heart risk or kidney health. Here are seven other numbers that reveal what A1C misses.

You get your bloodwork back.
Your eyes go straight to:
A1C.
Maybe it dropped from:
8.1% to 6.7%.
That's meaningful progress.
But here's the problem:
A1C cannot tell you whether your blood pressure is:
118/72
or:
158/94.
It cannot tell you whether your kidneys are beginning to leak albumin.
It cannot tell you whether your LDL cholesterol is:
65
or:
145 mg/dL.
And two people with exactly the same A1C can have very different glucose patterns throughout the day.
That's why diabetes care cannot be reduced to one laboratory number.
The 2026 American Diabetes Association Standards put it plainly:
Glycemic management is part of diabetes care — not the sole goal.
So here are seven other numbers worth understanding.
Fasting or premeal glucose
A1C tells you something about your average glucose over the previous few months.
Fasting glucose tells you something different:
what is happening right now — particularly when food isn't driving the number.
For many nonpregnant adults with diabetes, the ADA's usual premeal target is:
80–130 mg/dL.
But that target should be individualized.
Why is fasting glucose useful?
Because it can reveal problems A1C averages together.
Suppose two people both have:
A1C 7.0%.
Person A
Fasting glucose:
105 mg/dL
but large spikes after meals.
Person B
Fasting glucose:
155 mg/dL
with smaller post-meal increases.
Same A1C.
Different metabolic pattern.
The treatment questions may therefore be different too.
High fasting glucose can point toward issues such as excessive overnight liver glucose production, medication timing, late eating, illness, sleep disruption, or other factors.
That's why A1C and fasting glucose complement one another.
And post-meal glucose can reveal another piece
For many nonpregnant adults, the ADA lists a general peak post-meal glucose target of:
less than 180 mg/dL
measured roughly one to two hours after the beginning of a meal.
Again, individual targets differ.
Post-meal measurements can be particularly informative when:
premeal glucose looks good
but:
A1C remains higher than expected.
In that situation, the missing glucose exposure may be happening after meals.
So even before we leave glucose itself, A1C is already only one view.
Time in Range
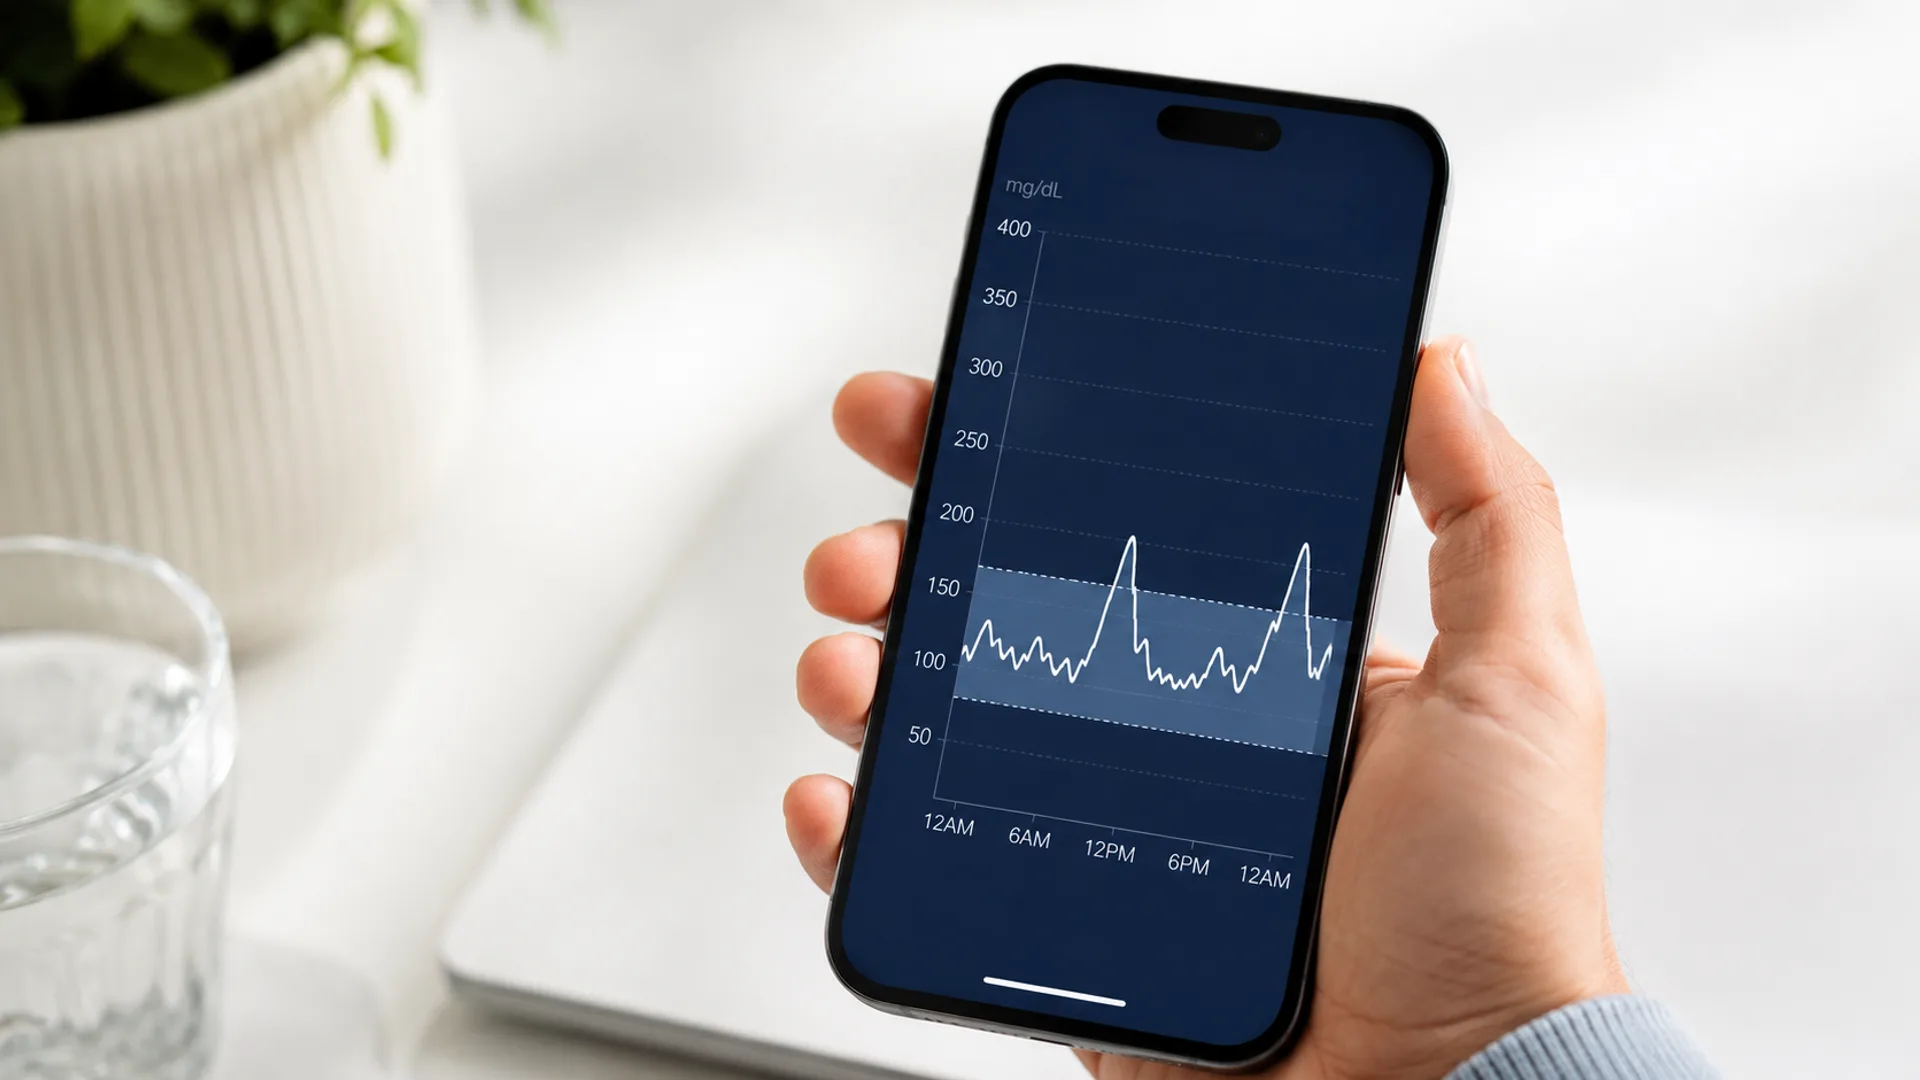
If you use a continuous glucose monitor, one of the most useful numbers is:
Time in Range — TIR.
For most nonpregnant adults with diabetes, the standard range is:
70–180 mg/dL.
The 2026 ADA recommends a goal of:
more than 70% of the day in range
for many adults.
That equals approximately:
16 hours and 48 minutes per day.
Why does this matter if you already know your A1C?
Because averages hide variation.
Consider two people with the same average glucose.
Person A
Their glucose stays relatively close to the target range most of the day.
Person B
Their glucose repeatedly swings:
55 → 240 → 65 → 260 mg/dL.
Their average could theoretically look similar.
Their day-to-day experience is not.
Time in range gives you information A1C cannot.
Time BELOW range matters too
A low A1C isn't automatically better if it is being achieved through frequent hypoglycemia.
For many adults using CGM, the ADA recommends spending:
less than 4% of the day below 70 mg/dL
and:
less than 1% below 54 mg/dL.
That second threshold equals less than about:
14 minutes per day.
This is why an A1C of:
6.2%
isn't automatically preferable to:
6.8%.
If the first person is repeatedly experiencing dangerous lows, their apparently "better" A1C may come with considerably greater treatment risk.
A1C cannot show you that.
CGM can.
Blood pressure
This might be the most underrated diabetes number on the list.
Type 2 diabetes substantially increases cardiovascular and kidney risk.
High blood pressure adds another major risk factor on top of it.
For people with diabetes and hypertension, the 2026 ADA recommends an on-treatment blood pressure goal of:
below 130/80 mmHg
when it can be safely achieved.
For people at particularly high cardiovascular or kidney risk, a systolic goal below:
120 mmHg
may be encouraged when appropriate and safely tolerated.
Those goals are individualized.
But here's why blood pressure deserves attention:
Treating hypertension in people with diabetes has been shown to reduce:
- cardiovascular events
- stroke risk
- kidney disease progression
- microvascular complications
So imagine this:
A1C
6.4%
Blood pressure
162/96 mmHg
It would be a mistake to look only at the A1C and conclude:
"Everything is handled."
It isn't.
A major 2024 trial made blood pressure especially interesting
The BPROAD trial studied people with:
- type 2 diabetes
- elevated cardiovascular risk
Researchers compared a more intensive systolic blood pressure target:
below 120 mmHg
with a standard target:
below 140 mmHg.
The intensive-treatment group experienced approximately:
21% fewer
events in a composite that included:
- nonfatal stroke
- nonfatal heart attack
- heart failure treatment or hospitalization
- cardiovascular death
That doesn't mean everyone with diabetes should independently push their pressure below 120.
More intensive blood-pressure treatment can also create:
- dizziness
- hypotension
- medication side effects
But it demonstrates why blood pressure deserves to sit beside A1C — not underneath it.
LDL cholesterol
Another number people sometimes ignore once their glucose improves is:
LDL cholesterol.
LDL particles are involved in the development of atherosclerosis — plaque accumulating within arteries.
And cardiovascular disease is a major concern in type 2 diabetes.
For adults with diabetes aged 40–75 who have higher cardiovascular risk, the 2026 ADA recommends lowering LDL cholesterol by at least:
50% from baseline
and reaching an LDL goal below:
70 mg/dL.
For people who already have established atherosclerotic cardiovascular disease, the recommended LDL goal is even lower:
below 55 mg/dL.
These are not universal targets for every person with diabetes.
Age, cardiovascular history, medications, pregnancy status, overall risk, and tolerance all matter.
But the evidence for lowering LDL in higher-risk people with diabetes is strong.
How strong?
A major analysis of statin trials found that among people with diabetes, every:
39 mg/dL reduction in LDL cholesterol
was associated with approximately:
21% fewer major cardiovascular events.
That is why someone can have:
excellent A1C
and still need serious attention paid to LDL.
Glucose management and cardiovascular risk management overlap.
They are not the same thing.
Triglycerides
Triglycerides are another part of a standard lipid panel.
They are particularly interesting in type 2 diabetes because elevated triglycerides often travel alongside:
- insulin resistance
- excess liver fat
- abdominal adiposity
- poor glucose control
The ADA considers fasting triglycerides:
150 mg/dL or higher
to be elevated.
For nonfasting measurements, a level above:
175 mg/dL
is considered elevated in its cardiovascular-risk guidance.
That does not mean triglycerides should always be treated with a medication.
The first question is often:
Why are they elevated?
Potential contributors include:
- poorly controlled diabetes
- excess calorie intake
- obesity
- alcohol
- hypothyroidism
- kidney or liver disease
- certain medications
Lifestyle and improved glycemic control can produce substantial changes.
Very high triglycerides are a different situation
Once fasting triglycerides reach:
500 mg/dL or higher
the conversation changes.
At that level, the ADA recommends evaluation for secondary causes and consideration of therapy because severe hypertriglyceridemia can increase the risk of:
acute pancreatitis.
And levels above:
1,000 mg/dL
raise even greater concern.
So triglycerides aren't simply a secondary cholesterol number to ignore.
They can tell you something about both:
metabolic health
and, at very high levels:
immediate medical risk.
eGFR
Now we move from the heart to the kidneys.
One of the most important kidney numbers is:
eGFR
or:
estimated glomerular filtration rate.
It estimates how effectively the kidneys are filtering blood.
The units are:
mL/min/1.73 m².
Unlike A1C:
higher is generally better.
An eGFR below:
60 mL/min/1.73 m²
can indicate chronic kidney disease when the abnormality persists or other criteria for CKD are present.
But one isolated eGFR below 60 does not automatically establish chronic kidney disease.
Kidney function can temporarily change because of:
- dehydration
- illness
- medication changes
- acute kidney injury
Chronic kidney disease involves abnormalities that persist for at least approximately three months.
Why this matters in type 2 diabetes
Diabetes is one of the major causes of chronic kidney disease.
And early kidney disease can be:
completely silent.
No pain.
No obvious urinary symptoms.
No feeling that the kidneys are struggling.
That's why the ADA recommends measuring eGFR:
at least once every year
in all people with type 2 diabetes, regardless of treatment.
If chronic kidney disease is already present, testing may be needed:
1–4 times per year
depending on severity.
But eGFR is only half of the kidney picture
This leads to number seven.
And it may be the one people are least familiar with.
UACR
UACR stands for:
urine albumin-to-creatinine ratio.
It measures how much of a protein called albumin is leaking into the urine relative to creatinine.
Healthy kidneys usually keep most albumin inside the bloodstream.
When the kidney's filtering structures become damaged, more albumin can begin appearing in urine.
That's why UACR can sometimes reveal kidney damage:
before eGFR has fallen dramatically.
The broad categories are:
Normal to mildly increased
below 30 mg/g
Moderately increased albuminuria
30–299 mg/g
Severely increased albuminuria
300 mg/g or higher
And just like eGFR, UACR is recommended:
at least annually
for everyone with type 2 diabetes.
Why you need BOTH eGFR and UACR
This is important.
You can have:
normal-looking eGFR
but:
elevated UACR.
That can indicate early kidney damage.
Or:
low eGFR
with relatively little albumin in the urine.
Different kidney-disease patterns exist.
So checking only serum creatinine or eGFR misses part of the picture.
The ADA specifically recommends using:
both eGFR + UACR.
Think of it like this:
eGFR asks:
How well are the kidneys filtering?
UACR asks:
Are the kidney filters leaking protein?
Different questions.
Both matter.
Albuminuria also tells us something about cardiovascular risk
This makes UACR even more important.
Higher urinary albumin isn't only associated with kidney disease progression.
It is also associated with:
greater cardiovascular risk.
So a person might have:
A1C
6.5%
eGFR
82
which looks reassuring.
But:
UACR
180 mg/g.
That changes the risk picture considerably.
And it can influence treatment decisions.
For example, certain blood-pressure and glucose-lowering medications have kidney-protective benefits that extend beyond simply lowering A1C.
Get the research, without the noise.
Practical, sourced writing on blood sugar and metabolic health. One email a week.
One email a week. Unsubscribe any time. See our privacy policy.
Put the seven numbers together
Imagine two people.
Both have:
A1C 6.8%.
You might assume they are metabolically in roughly the same place.
Now look deeper.
Person A
Fasting glucose: 112 mg/dL
Time in range: 82%
Blood pressure: 122/74
LDL: 64 mg/dL
Triglycerides: 105 mg/dL
eGFR: 92
UACR: 8 mg/g
Now:
Person B
Fasting glucose: 156 mg/dL
Time in range: 58%
Blood pressure: 154/92
LDL: 138 mg/dL
Triglycerides: 240 mg/dL
eGFR: 58
UACR: 210 mg/g
Same A1C.
Very different health picture.
That's the entire point of this article.
What about body weight and waist circumference?
They matter too.
We could easily make this:
8 or 9 numbers worth knowing.
Weight trends can provide valuable information, particularly when excess adiposity is contributing to insulin resistance.
Waist circumference can provide additional information about:
abdominal and visceral adiposity
that BMI alone may miss.
The 2026 ADA specifically recommends considering measures such as:
- waist circumference
- waist-to-height ratio
- waist-to-hip ratio
alongside BMI when additional information about adiposity is useful.
But there is no single universal waist number appropriate for every:
- sex
- ethnicity
- age
- body type
which is why we haven't turned it into one of the seven universal targets above.
The trend and clinical context matter more.
What about fasting insulin?
This is another number gaining popularity online.
There is legitimate science behind measuring insulin resistance.
But fasting insulin has important limitations:
- insulin assays are not fully standardized
- values vary between laboratories
- there is no universally accepted clinical cutoff for insulin resistance
Measures such as HOMA-IR are extremely useful in research.
They are less standardized as routine diagnostic targets in everyday diabetes care.
So fasting insulin may provide useful context in selected situations.
But it does not currently belong beside:
- blood pressure
- LDL
- eGFR
- UACR
as a universally established treatment target for every person with type 2 diabetes.
That's an important distinction between:
interesting metabolic information
and:
validated clinical risk markers.
Don't turn this into obsessive tracking
There is also a danger in articles like this.
You could walk away thinking you need to monitor:
seven numbers every morning.
You don't.
Some are measured daily or continuously only when clinically useful.
Others are checked:
- every few months
- annually
- or based on treatment and risk
For example:
Glucose
may be monitored frequently depending on medication and clinical needs.
Blood pressure
may be useful to monitor at home when hypertension is present.
Lipids
are typically checked periodically.
eGFR and UACR
should generally be assessed at least annually in type 2 diabetes and more frequently when kidney disease is present.
The goal isn't more data.
It's better data.
The Health Facts takeaway
A1C deserves its importance.
It is strongly linked with diabetes complications and remains one of the most useful measures of longer-term glucose exposure.
But diabetes affects more than glucose.
It affects — and is affected by — the:
heart
blood vessels
kidneys
liver
body composition
and:
day-to-day glucose pattern.
So instead of thinking:
"My A1C is good, therefore my diabetes is handled."
a more complete picture asks:
1. Fasting/premeal glucose What happens when I'm not eating?
2. Time in range What does my glucose actually do throughout the day?
3. Blood pressure What pressure are my blood vessels and kidneys experiencing?
4. LDL cholesterol What is my atherosclerotic cardiovascular risk picture?
5. Triglycerides What might my lipid and metabolic state be telling us?
6. eGFR How well are my kidneys filtering?
7. UACR Are my kidneys leaking albumin?
None of these replaces A1C.
Together, they make A1C more meaningful.
Because the goal of diabetes care isn't simply:
produce a lower laboratory number.
It's to reduce the probability of:
- heart attack
- stroke
- kidney disease
- vision loss
- neuropathy
- hypoglycemia
- other complications
while maintaining a life you can actually live.
That takes more than one number.
So celebrate a better A1C.
You should.
But then zoom out and ask:
"What does the rest of the dashboard look like?"
That's where the fuller story begins.
Quick Reference
| Measure | Common reference or treatment goal for many adults* |
|---|---|
| A1C | <7% for many nonpregnant adults |
| Premeal glucose | 80–130 mg/dL |
| Time in range (CGM) | >70% between 70–180 mg/dL |
| Blood pressure | <130/80 mmHg when safely attainable in people with hypertension |
| LDL cholesterol | Depends on cardiovascular risk; <70 mg/dL for many higher-risk adults aged 40–75, <55 mg/dL with established ASCVD |
| Triglycerides | ≥150 mg/dL fasting is considered elevated |
| eGFR | <60 mL/min/1.73 m² may indicate CKD when persistent/appropriately confirmed |
| UACR | <30 mg/g is normal-to-mildly increased; ≥30 mg/g indicates albuminuria |
*These are general guideline values, not personalized targets. Appropriate goals vary with age, health status, medications, cardiovascular and kidney risk, pregnancy, hypoglycemia risk, and other clinical factors.
Sources
- 1. American Diabetes Association Professional Practice Committee for Diabetes. Comprehensive Medical Evaluation and Assessment of Comorbidities: Standards of Care in Diabetes—2026. Diabetes Care, 2026.
- 2. American Diabetes Association Professional Practice Committee for Diabetes. Glycemic Goals, Hypoglycemia, and Hyperglycemic Crises: Standards of Care in Diabetes—2026. Diabetes Care, 2026.
- 3. American Diabetes Association Professional Practice Committee for Diabetes. Cardiovascular Disease and Risk Management: Standards of Care in Diabetes—2026. Diabetes Care, 2026.
- 4. American Diabetes Association Professional Practice Committee for Diabetes. Chronic Kidney Disease and Risk Management: Standards of Care in Diabetes—2026. Diabetes Care, 2026.
- 5. American Diabetes Association Professional Practice Committee for Diabetes. Obesity and Weight Management for the Prevention and Treatment of Diabetes: Standards of Care in Diabetes—2026. Diabetes Care, 2026. doi:10.2337/dc26-S008
- 6. Battelino T, Danne T, Bergenstal RM, et al. Clinical Targets for Continuous Glucose Monitoring Data Interpretation: Recommendations From the International Consensus on Time in Range. Diabetes Care, 2019. doi:10.2337/dci19-0028
- 7. Cholesterol Treatment Trialists' Collaborators. Efficacy of Cholesterol-Lowering Therapy in 18,686 People With Diabetes in 14 Randomised Trials of Statins: A Meta-analysis. Lancet, 2008. doi:10.1016/S0140-6736(08)60104-X
Comments
No comments yet.
Leave a comment
Comments are moderated. Be kind and stay on topic.