Blood Sugar
Time in Range: The Blood Sugar Number Your A1C Doesn't Show You
Two people can have the same A1C while spending very different amounts of their day with high, low, or stable glucose. Time in Range shows what the average leaves out.
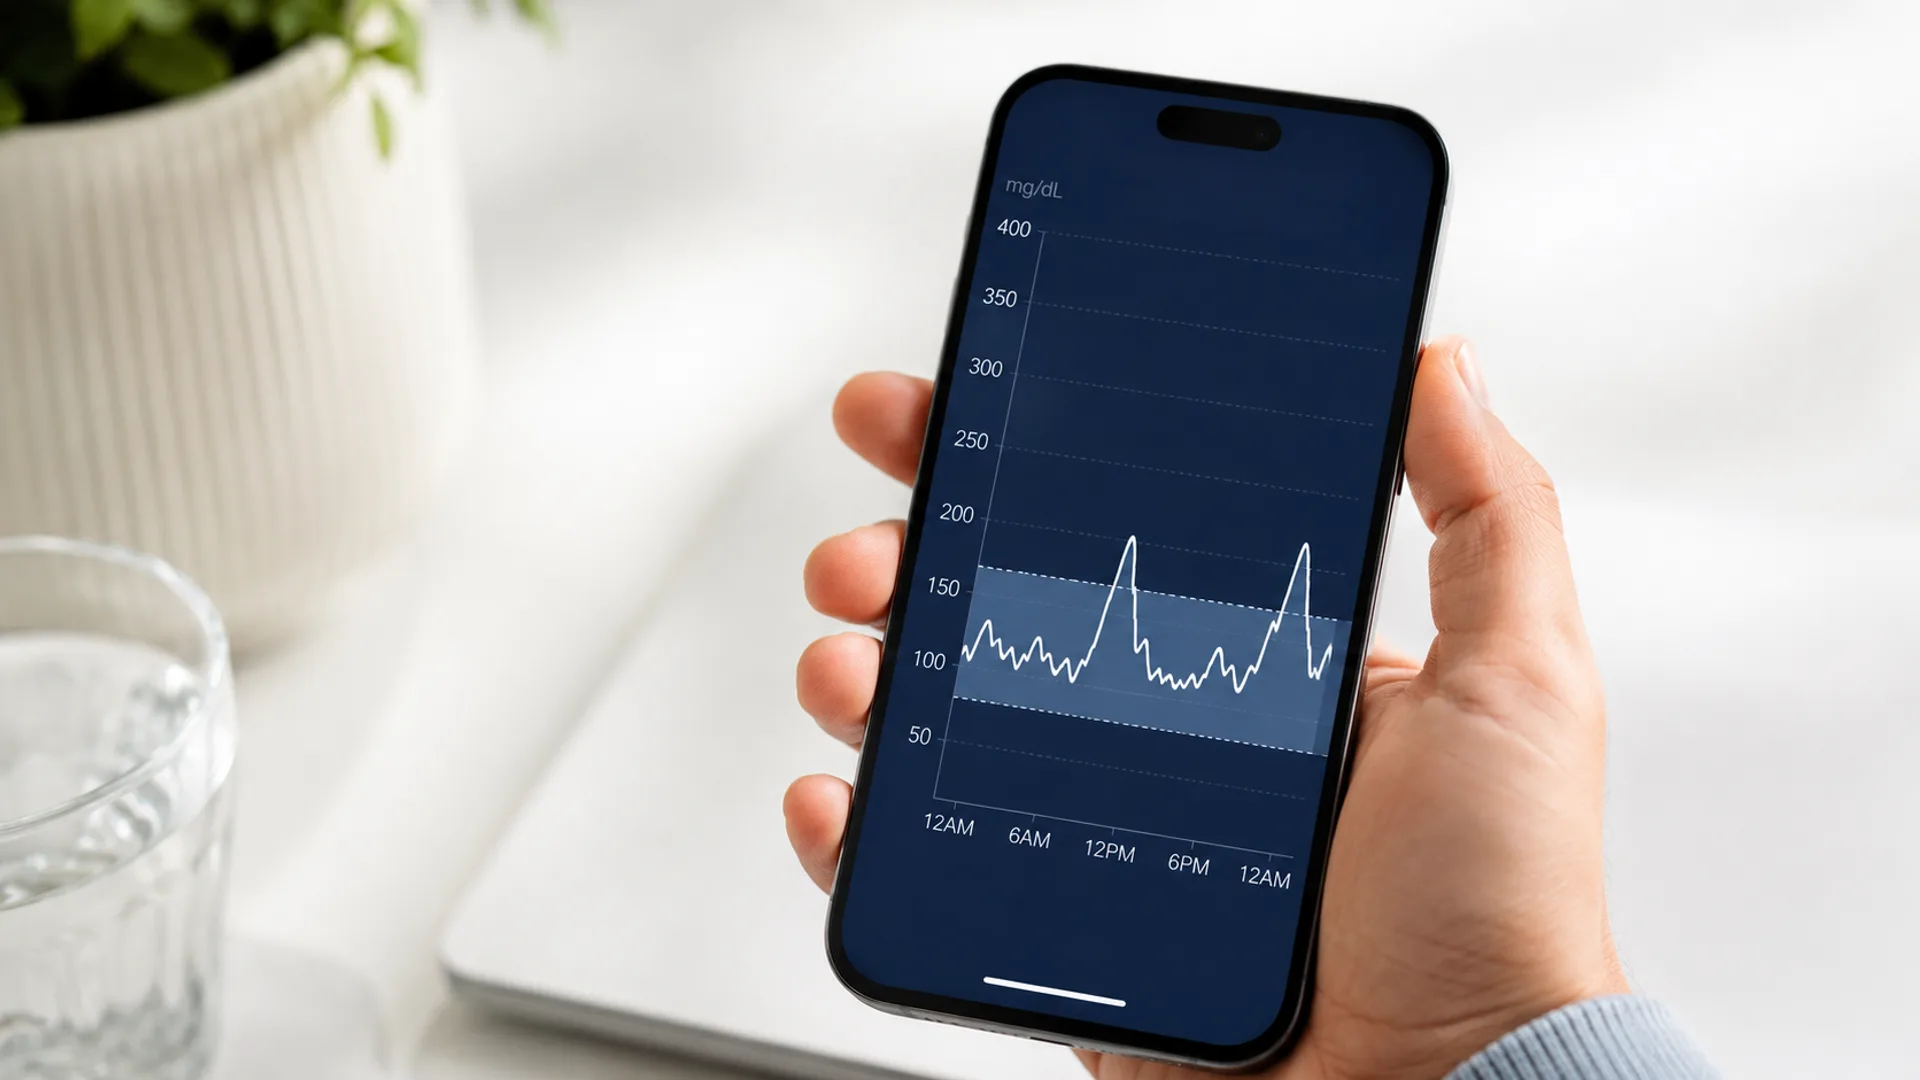
Imagine two people both have an A1C of 7.0%.
At first glance, their glucose control appears identical.
But put a continuous glucose monitor on both of them and you might see something very different.
One person's glucose could spend most of the day between 90 and 160 mg/dL.
The other's could repeatedly jump above 220, then fall below 70, before eventually averaging out to roughly the same A1C.
Same average. Very different day.
That's exactly why another measurement has become increasingly important in diabetes care:
Time in Range.
What is Time in Range?
Time in Range — usually abbreviated TIR — is the percentage of time your glucose stays inside a predefined target range.
For most nonpregnant adults with type 1 or type 2 diabetes using a continuous glucose monitor, the standard range is:
70–180 mg/dL
So if your CGM says:
Time in Range: 70%
that means your glucose spent approximately 70% of the measured time between 70 and 180 mg/dL.
Over 24 hours, that's:
16 hours and 48 minutes in range.
The other 7 hours and 12 minutes were spent either above or below that range.
And that extra information is what A1C can't show you.
A1C tells you the average. TIR tells you the pattern.
As we explained in What A1C Actually Measures, A1C estimates your glucose exposure over approximately the previous 2–3 months.
That makes it extremely useful.
But it cannot tell you:
- how often glucose rises above 180
- whether you're experiencing lows
- how long post-meal spikes last
- whether glucose is relatively stable
- whether certain meals repeatedly cause large excursions
- what happens overnight
Time in Range adds that missing dimension.
Think of it this way:
A1C = your average speed for the entire trip.
CGM data = what happened mile by mile.
An average speed of 60 mph could mean you drove steadily at 60...
or alternated between 30 and 90 the entire way.
The average alone can't tell you.
The ADA now considers Time in Range an important treatment goal
The 2026 American Diabetes Association Standards of Care recommend a Time in Range goal of:
More than 70%
for many nonpregnant adults using CGM.
The accompanying targets for most adults are:
| CGM measurement | General target |
|---|---|
| 70–180 mg/dL | >70% of the day |
| Above 180 mg/dL | <25% |
| Above 250 mg/dL | <5% |
| Below 70 mg/dL | <4% |
| Below 54 mg/dL | <1% |
Translated into actual time:
>70% in range = more than 16 hours 48 minutes
<4% below 70 = less than about 58 minutes
<1% below 54 = less than about 14 minutes
These are general treatment targets — not universal goals for every person.
Age, medications, pregnancy, health status, hypoglycemia risk, and other conditions can change the appropriate target.
For example, the ADA uses less stringent CGM targets for some older adults with complex health conditions, where avoiding dangerous low glucose may be more important than aggressively maximizing Time in Range.
Why 70%?
The number isn't arbitrary.
Researchers have repeatedly found a strong relationship between Time in Range and A1C.
Large analyses suggest that a TIR around:
70%
often corresponds approximately to an:
A1C around 7%
And increasing TIR by an absolute 10 percentage points — about 2 hours and 24 minutes more per day inside the target range — has been associated with meaningful reductions in A1C.
Different datasets produce somewhat different estimates, roughly around 0.5–0.8 percentage points of A1C per 10% change in TIR.
That does not mean you can convert one perfectly into the other.
Different people can have different A1Cs at the same Time in Range.
But the relationship is strong enough that TIR has become an accepted clinical measure of glucose control.
The bigger benefit: TIR shows you where the problem is
Suppose your CGM report says:
Time in Range: 58%
That number alone is useful.
But the real value comes from asking:
Where did the remaining 42% go?
Consider two very different possibilities.
Person A
- 58% in range
- 41% above range
- 1% below range
The primary issue appears to be hyperglycemia.
Now compare that with:
Person B
- 58% in range
- 20% above range
- 22% below range
Same Time in Range.
Completely different clinical problem.
Person B is spending a dangerous amount of time with low glucose.
Simply trying harder to "lower blood sugar" could make things worse.
That's why CGM reports usually separate glucose into three major categories:
TIR — Time in Range
Glucose between 70 and 180 mg/dL.
TAR — Time Above Range
Glucose above 180 mg/dL.
TBR — Time Below Range
Glucose below 70 mg/dL.
Together, they tell a much richer story.
You can also see when glucose is leaving the range
This is where CGM becomes especially useful in everyday life.
Perhaps your glucose is relatively stable overnight...
then jumps every morning after breakfast.
Or breakfast looks fine...
but dinner pushes glucose above 200 mg/dL for three hours.
Or your glucose repeatedly falls during an afternoon workout.
A1C doesn't show any of that.
CGM can.
And because the monitor records glucose throughout the day, patterns can emerge around:
- specific foods
- meal size
- meal timing
- walking after meals
- exercise
- sleep
- stress
- medication timing
This is one reason CGM is often described as a way of seeing glucose dynamics, not simply glucose averages.
The useful question becomes less:
"Was my glucose high today?"
and more:
"What consistently makes it rise, how high does it go, and how quickly does it come back?"
A higher spike isn't the only thing worth noticing
Social media has created a tendency to obsess over every glucose spike.
That isn't the goal.
Glucose is supposed to rise after eating.
The body receives nutrients.
Glucose enters the bloodstream.
Insulin rises.
Tissues use or store the incoming fuel.
Then glucose comes back down.
A completely flat glucose line is not a requirement for metabolic health.
The more useful questions are:
- How high does glucose rise?
- How long does it stay elevated?
- How often does this happen?
- Does it return toward baseline efficiently?
- Are there frequent lows?
- What does the overall pattern look like?
One unusual meal doesn't tell you much.
Repeated patterns do.
Time in Range may also relate to diabetes complications
A1C became important partly because higher long-term glucose exposure predicts the risk of diabetes complications.
Researchers have asked whether Time in Range does the same.
The evidence is increasingly supportive, although much of it is observational or based on retrospective analyses.
In one study involving 3,262 people with type 2 diabetes, those with more advanced diabetic retinopathy tended to spend less time in the 70–180 mg/dL range.
The association remained significant even after researchers adjusted for factors including A1C.
Another analysis using glucose profiles from the landmark Diabetes Control and Complications Trial found that each 10% reduction in TIR was associated with higher rates of progression of retinopathy and microalbuminuria.
These studies don't prove that simply increasing TIR by itself prevents complications.
But they reinforce the idea that how much time glucose spends outside the desired range matters.
Get the research, without the noise.
Practical, sourced writing on blood sugar and metabolic health. One email a week.
One email a week. Unsubscribe any time. See our privacy policy.
Don't confuse Time in Range with diagnosing diabetes
There is an important limitation.
CGMs are becoming easier to obtain, including for people who do not use insulin.
But the ADA currently states that there is not enough evidence to use CGM for diagnosing diabetes or prediabetes.
Diagnosis still relies on validated tests such as:
- A1C
- fasting plasma glucose
- oral glucose tolerance testing
- random plasma glucose in appropriate clinical circumstances
So if someone without diabetes wears a CGM and sees a few readings above 180...
that does not automatically mean they have diabetes.
Likewise, the standard 70–180 treatment range was developed primarily for people living with diabetes.
It should not be turned into a universal wellness score for everyone.
What about glucose variability?
There's another metric CGM can reveal:
Glucose variability.
This measures how widely glucose swings around the average.
One common measure is the coefficient of variation, or CV.
The ADA currently lists:
≤36%
as a general glucose-variability goal.
Higher variability has been associated particularly with increased risk of hypoglycemia.
So now we have several pieces:
Average glucose
Time in Range
Time Above Range
Time Below Range
Glucose variability
Together, they provide much more information than any single measurement.
The Health Facts takeaway
A1C remains one of the most useful measures in diabetes care.
But it compresses thousands of glucose readings into one average number.
Time in Range opens that average back up.
It lets you see:
how often you're high
how often you're low
how stable glucose is
when problems occur
and
how your body responds to everyday life.
That's important because metabolic health isn't simply about achieving one laboratory number every three months.
It's about what your body is doing:
breakfast
→ lunch
→ exercise
→ dinner
→ sleep
→ fasting
→ morning
again and again.
A useful goal isn't necessarily a perfectly flat glucose line.
It's a body that can handle incoming fuel efficiently and return toward balance without excessive highs, lows, or prolonged excursions.
That's another way of describing metabolic flexibility.
A1C gives you the summary.
Time in Range lets you see the story underneath it.
Sources
- 1. American Diabetes Association Professional Practice Committee. Glycemic Goals, Hypoglycemia, and Hyperglycemic Crises: Standards of Care in Diabetes—2026. Diabetes Care, 2026.
- 2. American Diabetes Association Professional Practice Committee. Diabetes Technology: Standards of Care in Diabetes—2026. Diabetes Care, 2026.
- 3. CGM & Time in Range. American Diabetes Association.
- 4. Battelino T, Danne T, Bergenstal RM, et al. Clinical Targets for Continuous Glucose Monitoring Data Interpretation: Recommendations From the International Consensus on Time in Range. Diabetes Care, 2019. doi:10.2337/dci19-0028
- 5. Vigersky RA, McMahon C. The Relationship of Hemoglobin A1C to Time-in-Range in Patients With Diabetes. Diabetes Technology & Therapeutics, 2019. doi:10.1089/dia.2018.0310
- 6. Lu J, Ma X, Zhou J, et al. Association of Time in Range, as Assessed by Continuous Glucose Monitoring, With Diabetic Retinopathy in Type 2 Diabetes. Diabetes Care, 2018. doi:10.2337/dc18-1131
- 7. Beck RW, Bergenstal RM, Riddlesworth TD, et al. Validation of Time in Range as an Outcome Measure for Diabetes Clinical Trials. Diabetes Care, 2019.
Comments
No comments yet.
Leave a comment
Comments are moderated. Be kind and stay on topic.