Blood Sugar
What A1C Actually Measures — and What It Can Miss
A1C is one of the most useful numbers for understanding blood sugar, but it is still an average. Here is what the test actually measures — and what it cannot tell you.

A1C is one of the most useful numbers we have for understanding blood sugar. But it is still only one number.
Two people can have the same A1C and experience very different things throughout the day.
One may have relatively steady glucose.
The other may bounce between large spikes and lows and still end up with a similar average.
So what exactly is A1C measuring?
And just as importantly: what isn't it measuring?
What A1C actually measures
A1C stands for hemoglobin A1C, also called HbA1c.
Hemoglobin is the protein inside red blood cells that carries oxygen. As glucose circulates through your bloodstream, some of it naturally attaches to hemoglobin.
This process is called glycation.
The more glucose your red blood cells are exposed to, the more glycated hemoglobin tends to accumulate.
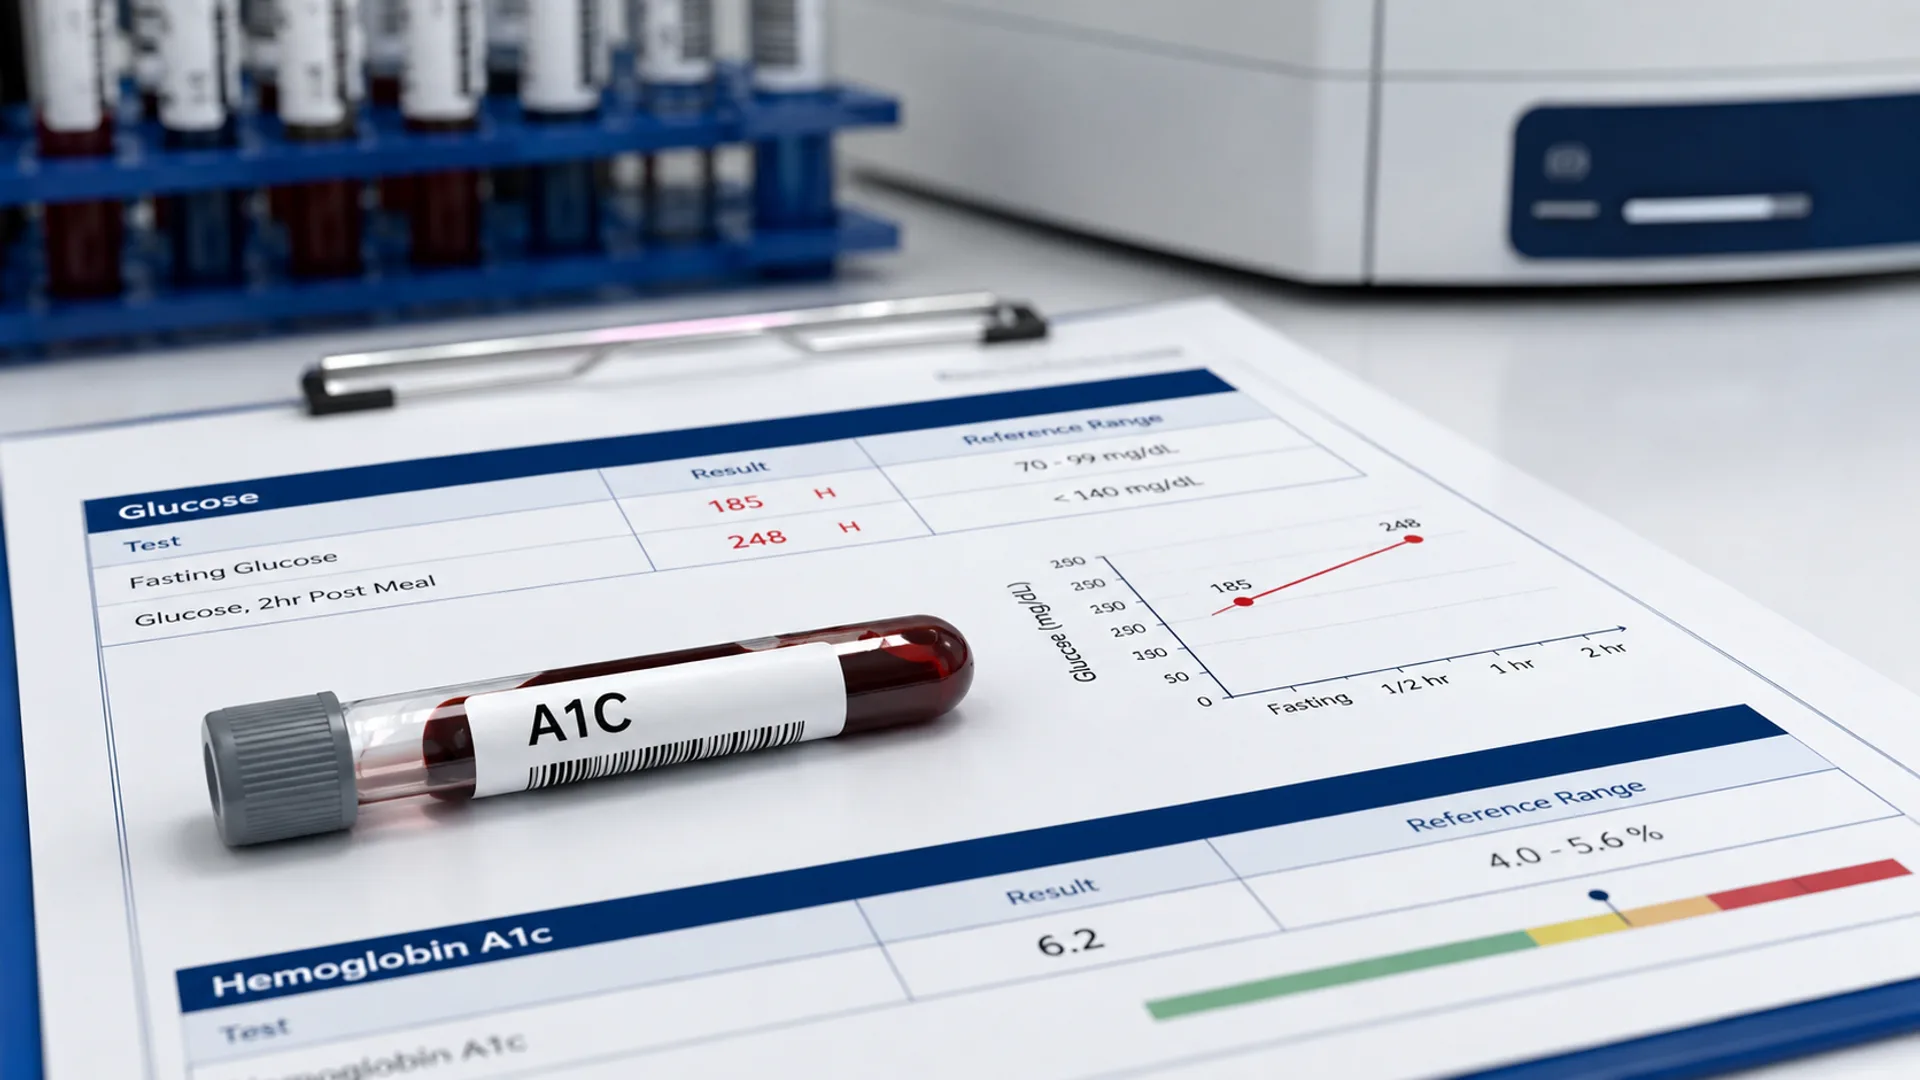
An A1C test measures the percentage of your hemoglobin that has glucose attached to it.
So an A1C of 7% does not mean your blood is "7% sugar."
It means approximately 7% of the hemoglobin measured in the sample is glycated.
Why A1C looks back several months
Red blood cells typically circulate for roughly 120 days.
That is why A1C gives doctors a picture of glucose exposure over approximately the previous 2–3 months, rather than showing what your blood sugar happens to be at the moment the blood is drawn.
But there is an important detail people often miss:
A1C is not an equal average of every day over the last three months.
More recent glucose exposure influences the result more strongly than glucose levels from three or four months ago.
That means meaningful improvements — or deteriorations — can begin showing up in A1C before an entire 120-day red-blood-cell cycle has passed.
What the common A1C ranges mean
For diagnosing diabetes, the commonly used ranges are:
| A1C | General interpretation |
|---|---|
| Below 5.7% | Normal range |
| 5.7%–6.4% | Prediabetes range |
| 6.5% or higher | Diabetes range |
Diagnosis normally requires appropriate clinical testing and, in the absence of unequivocal hyperglycemia, confirmation with repeat or additional testing.
A1C can also be translated into an estimated average glucose, or eAG.
For example:
| A1C | Approximate estimated average glucose |
|---|---|
| 5.7% | ~117 mg/dL |
| 6.5% | ~140 mg/dL |
| 7.0% | ~154 mg/dL |
| 8.0% | ~183 mg/dL |
These are estimates, not exact conversions for every individual.
And that brings us to A1C's biggest limitation.
An average can hide a lot
Imagine two people both have an average glucose of 120 mg/dL.
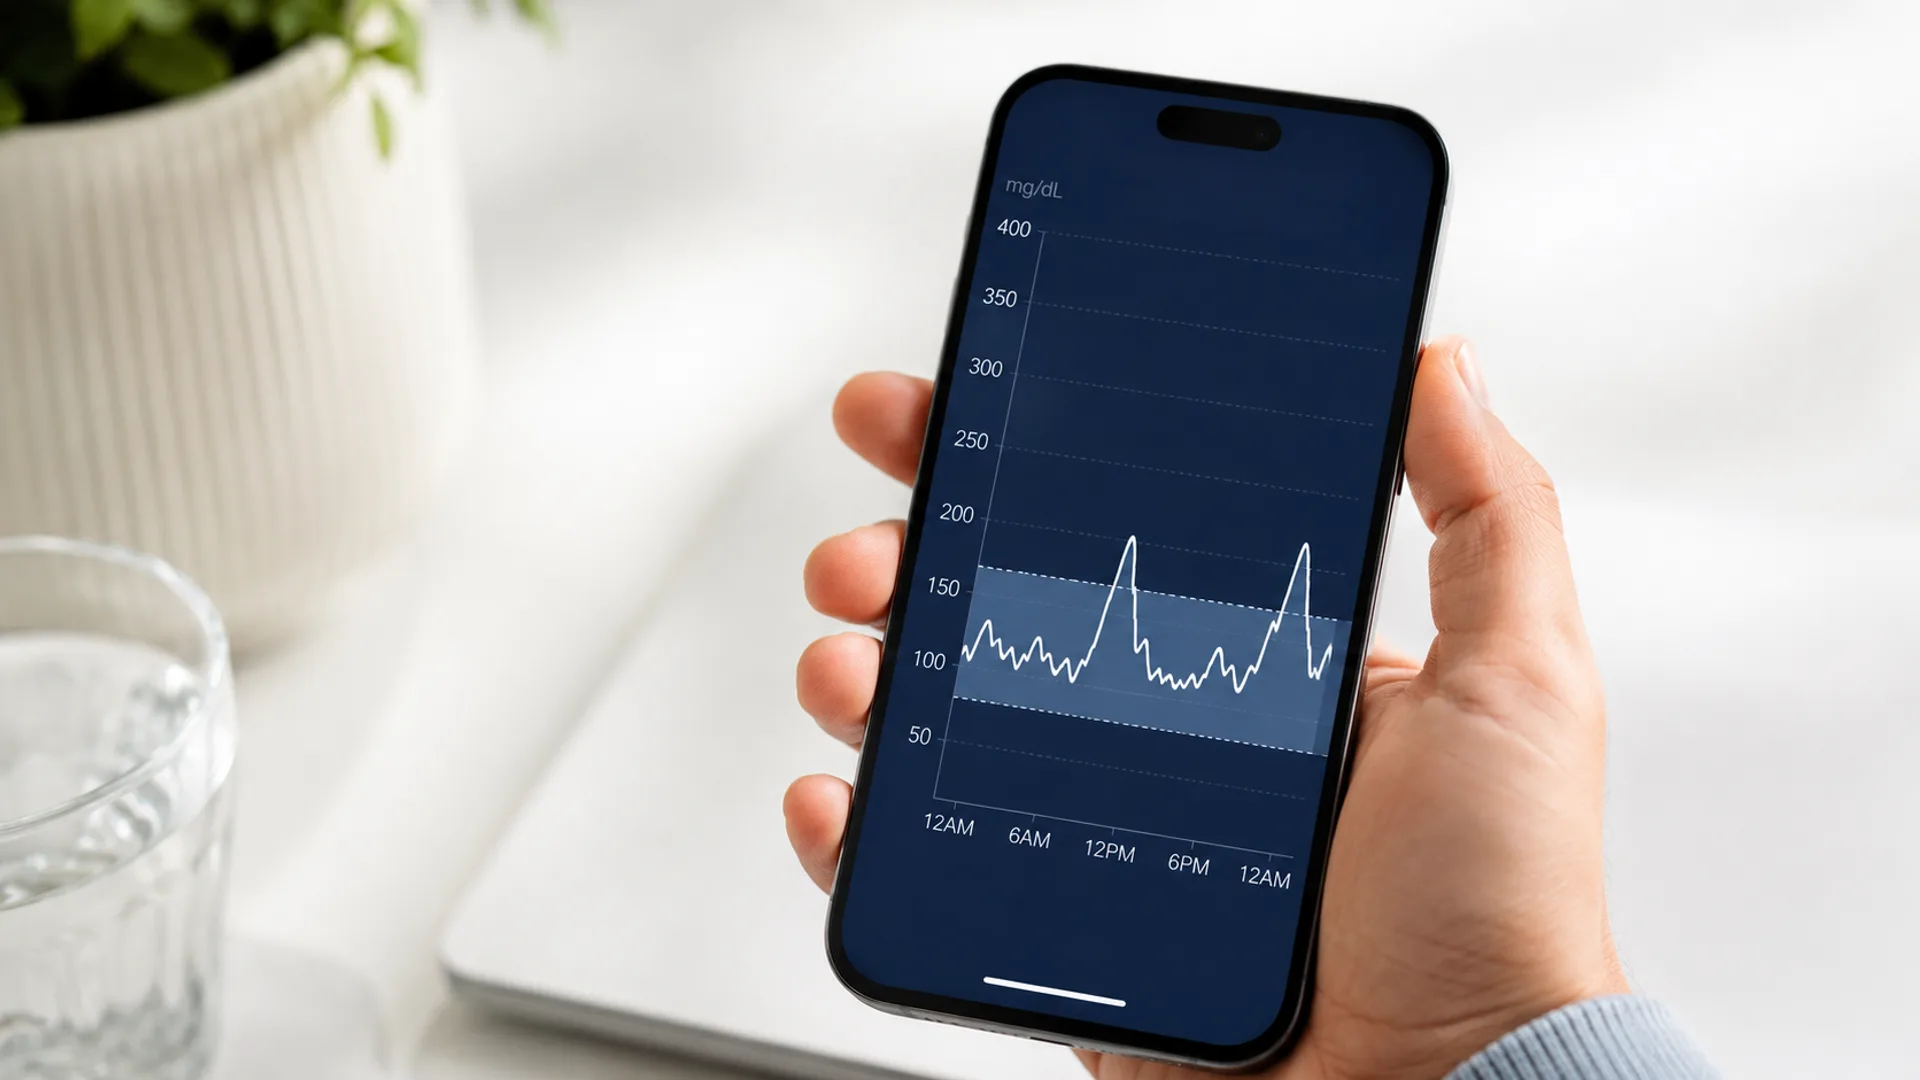
Person A spends most of the day somewhere around 100–140.
Person B repeatedly rises to 180–200 after meals, then falls back toward 70–80.
Their averages could end up surprisingly similar.
Their glucose patterns are not.
The American Diabetes Association specifically notes that A1C does not measure glucose variability, real-time glucose levels, or episodes of low blood sugar.
This is one reason continuous glucose monitoring can add information that an A1C test simply cannot provide.
Think of it this way:
A1C tells you the average temperature.
It doesn't tell you whether every day was 70°F...
...or whether half the days were 40°F and the other half were 100°F.
The average alone cannot show you the pattern.
A1C doesn't measure insulin
There is another important limitation.
A1C measures glucose exposure. It does not measure how much insulin your body needed to keep that glucose there.
This matters because insulin resistance can develop while the pancreas is still capable of producing additional insulin.
Early on, the body may compensate for reduced insulin sensitivity by producing more insulin.
Blood glucose can therefore remain relatively normal for a period of time even though the metabolic system is already working harder to keep it there.
Only when that compensation becomes insufficient does glucose tend to rise more noticeably.
This is one reason a normal A1C should not automatically be interpreted as proof that every aspect of metabolic health is perfect.
This is why glucose and insulin are sometimes assessed together, and why tests such as glucose-tolerance testing or continuous glucose monitoring may be used when more detail is needed.
A1C can sometimes be misleading for another reason
A1C depends on more than glucose.
It also depends on your red blood cells.
Anything that significantly changes how long red blood cells survive — or affects the hemoglobin being measured — can change the result.
Examples include:
- Iron-deficiency anemia, which can sometimes push A1C higher
- Recent blood loss, which can falsely lower it
- A recent blood transfusion
- Hemolytic anemia
- Kidney failure or dialysis
- Pregnancy
- Medications that stimulate red-blood-cell production
- Certain hemoglobin variants, including some associated with sickle cell disease or thalassemia
The effect is not identical in every situation or with every laboratory assay.
The important clue is often a mismatch.
If your A1C says one thing but repeated glucose readings consistently tell a very different story, that discrepancy is worth discussing with your healthcare professional rather than simply assuming one number must be right.
So should you stop paying attention to A1C?
No.
Quite the opposite.
A1C remains one of the most useful tools available for tracking long-term glucose exposure.
It is convenient.
You do not need to fast.
It is much less influenced by whether you slept badly last night, exercised that morning, or ate breakfast two hours before the test than a single glucose measurement can be.
And decades of research have linked higher A1C levels with diabetes complications.
The mistake isn't using A1C.
The mistake is expecting A1C to tell you everything.
Get the research, without the noise.
Practical, sourced writing on blood sugar and metabolic health. One email a week.
One email a week. Unsubscribe any time. See our privacy policy.
What can give you more context?
Depending on the situation, a healthcare professional may look at A1C alongside other information such as:
- Fasting glucose
- Post-meal glucose
- Continuous glucose monitor data
- Time in range
- Time above and below range
- Glucose variability
- An oral glucose tolerance test
- Fructosamine or glycated albumin when A1C is unreliable
Not everybody needs every test.
The point is simply that different measurements answer different questions.
A1C answers:
"What has my average glucose exposure looked like recently?"
It does not necessarily answer:
"What happens after I eat?"
"How high are my glucose peaks?"
"How much insulin am I producing?"
"How stable is my glucose?"
"How insulin-sensitive am I?"
Those are different questions.
The Health Facts takeaway
A useful way to think about A1C is as a report card, not the entire class.
It summarizes what has been happening with glucose over time.
That makes it extremely valuable.
But the ultimate goal shouldn't simply be to chase one laboratory number.
The bigger goal is to improve how well your body handles energy in everyday life — after meals, between meals, during exercise, while sleeping, and over time.
That includes glucose.
It also includes insulin sensitivity, muscle activity, food quality, sleep, body composition and the ability to move between different fuel sources when needed — sometimes described as metabolic flexibility.
This is also why sustainable changes matter more than trying to manufacture a perfect week before your next blood test.
A1C is the summary.
Understanding what is happening underneath that summary is where things become much more useful.
Sources
- 1. Glycemic Goals, Hypoglycemia, and Hyperglycemic Crises: Standards of Care in Diabetes—2026. Diabetes Care (American Diabetes Association), 2026. doi:10.2337/dc26-S006
- 2. Diagnosis and Classification of Diabetes: Standards of Care in Diabetes—2026. Diabetes Care (American Diabetes Association), 2026. doi:10.2337/dc26-S002
- 3. The A1C Test & Diabetes. National Institute of Diabetes and Digestive and Kidney Diseases.
- 4. Factors That Interfere With HbA1c Test Results. National Glycohemoglobin Standardization Program, 2026.
- 5. Translating the A1C Assay Into Estimated Average Glucose Values. Diabetes Care, 2008. doi:10.2337/dc08-0545
Comments
No comments yet.
Leave a comment
Comments are moderated. Be kind and stay on topic.