Blood Sugar
A1C vs. Fasting Glucose vs. Post-Meal Glucose: Why the Numbers Don't Always Agree
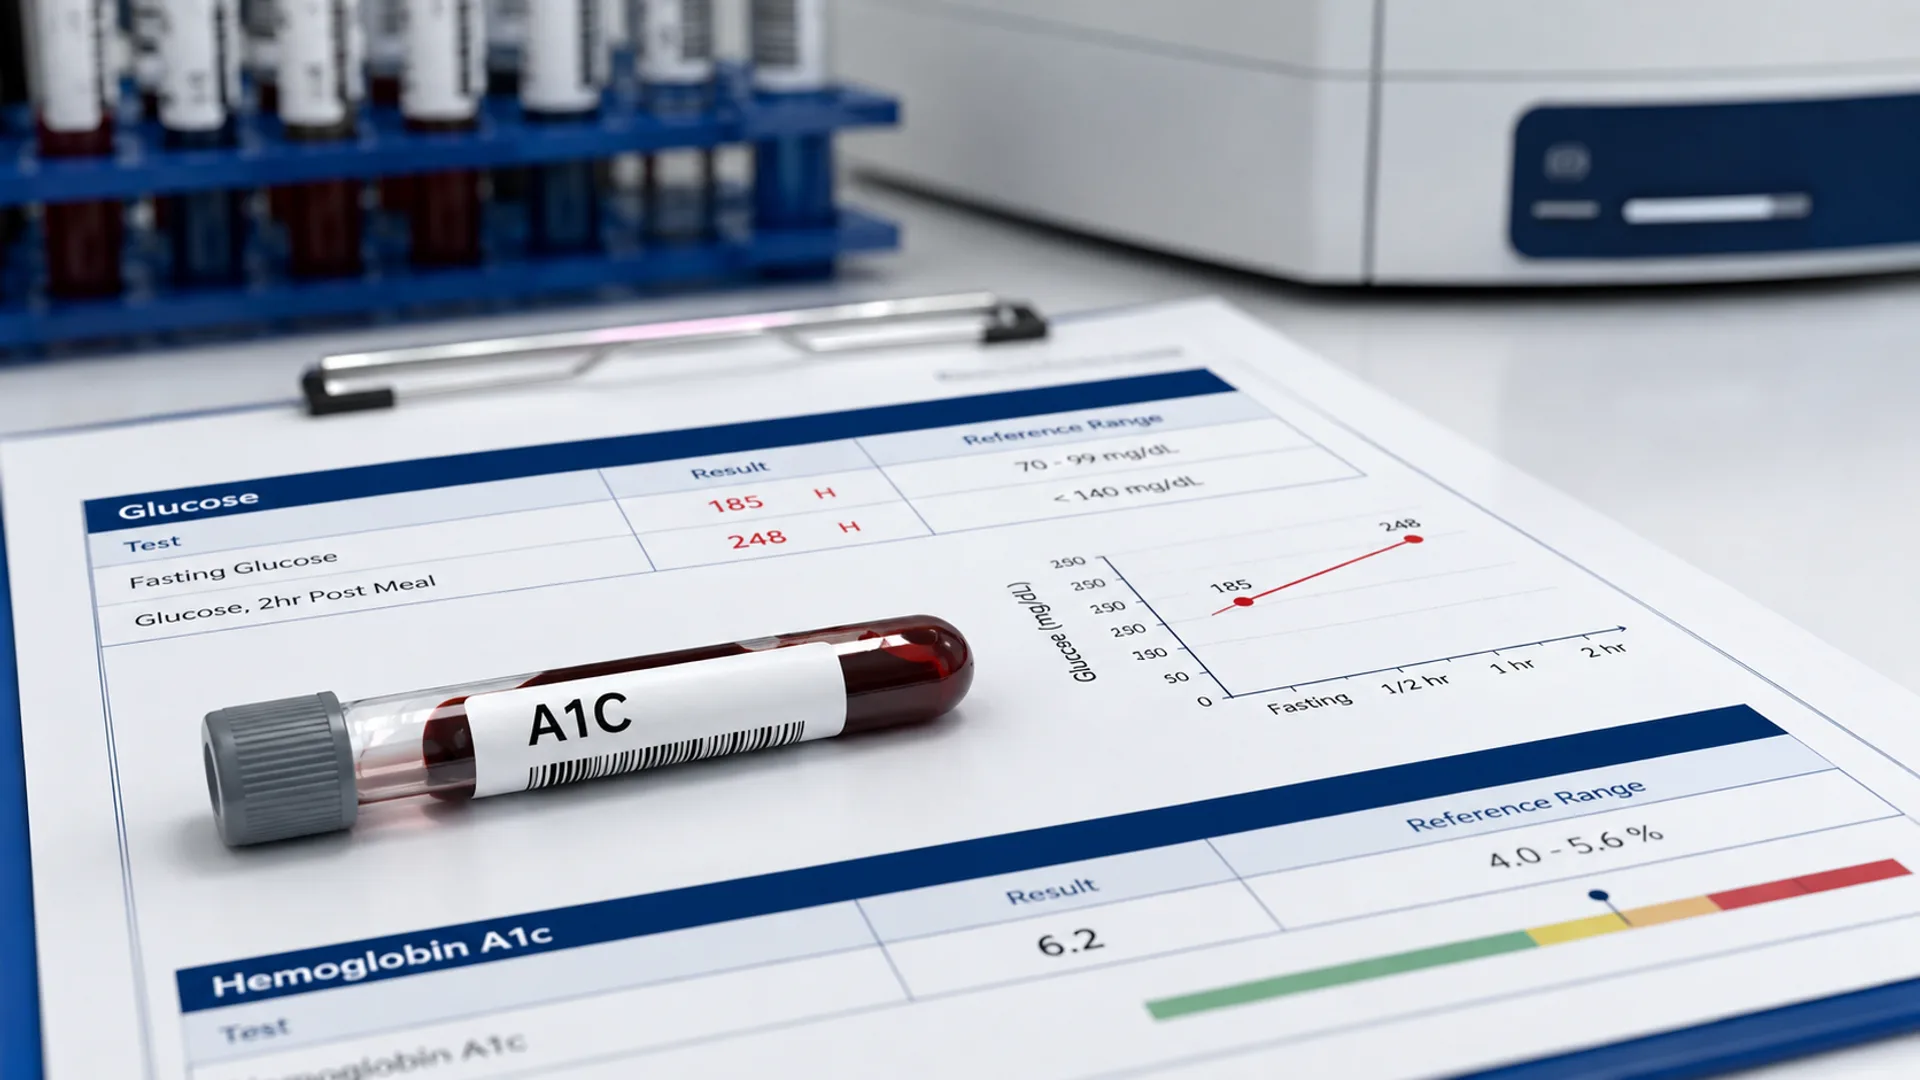
Your A1C can look good while your morning glucose runs high — or fasting glucose can look normal while it spikes after meals. These numbers measure different things.
You get your bloodwork back.
Your A1C looks pretty good.
But your morning glucose is higher than you expected.
Or perhaps the opposite happens:
Your fasting glucose looks normal, yet two hours after eating, your blood sugar climbs much higher than you thought it would.
Which number should you believe?
Potentially all of them.
The reason is simple:
A1C, fasting glucose and post-meal glucose are not three versions of the same test.
They are looking at your glucose metabolism through three different windows.
Think of them as three different questions
A useful way to separate them is:
| Measurement | The question it answers |
|---|---|
| A1C | What has my average glucose exposure looked like over the last few months? |
| Fasting glucose | What is my glucose doing after I haven't eaten for at least 8 hours? |
| Post-meal glucose | How well does my body handle a glucose challenge after food? |
None gives the entire picture by itself.
And according to the American Diabetes Association, the tests do not always identify the same people as having abnormal glucose metabolism.
That isn't a flaw.
They're measuring different aspects of the system.
A1C is the long-term view
As we explained in our guide to what A1C actually measures, A1C reflects glucose attached to hemoglobin in your red blood cells.
It gives an estimate of glucose exposure over roughly the previous 2–3 months.
That's useful because one bad dinner or one stressful morning is unlikely to dramatically change your A1C.
But the tradeoff is that averages can hide what happens hour by hour.
You could have:
- relatively stable glucose throughout the day
or
- repeated rises after meals followed by lower readings later
and end up with a similar average.
So:
A1C is excellent for seeing the forest.
It isn't always very good at showing you the individual trees.
Fasting glucose is a snapshot
Fasting plasma glucose is usually measured after at least 8 hours without calories.
For diagnosing prediabetes and diabetes in nonpregnant adults, current ADA ranges include:
| Fasting plasma glucose | Interpretation |
|---|---|
| Below 100 mg/dL | Below the prediabetes diagnostic range |
| 100–125 mg/dL | Prediabetes / impaired fasting glucose |
| 126 mg/dL or higher | Diabetes range when appropriately confirmed |
Unlike A1C, fasting glucose tells you what is happening at one moment in time.
And that number can move.
NIDDK notes that fasting glucose has considerably more within-person biological variability than A1C and can be influenced by short-term factors including:
- stress
- illness
- recent activity
- sleep
- time of day
Your liver also plays a major role.
Even when you haven't eaten overnight, your body still needs glucose.
The liver releases stored glucose into the bloodstream to make sure your brain and other tissues have fuel available.
Hormones that rise toward morning can increase that glucose output further — one reason some people experience the dawn phenomenon.
So a higher morning reading does not necessarily mean:
"I must have eaten something wrong."
You haven't eaten.
The glucose can be coming from inside your own body.
Why fasting glucose can look normal when another test doesn't
This is where things get especially interesting.
A person can have relatively normal glucose while fasting but have more difficulty processing glucose after a challenge.
For example:
Imagine someone has a fasting glucose of:
95 mg/dL
That's below the prediabetes fasting threshold.
But after a standardized 75-gram oral glucose tolerance test, their glucose is:
170 mg/dL at two hours.
That second number falls in the ADA's impaired glucose tolerance / prediabetes range of 140–199 mg/dL.
Same person.
Same metabolism.
Two very different-looking numbers.
The fasting measurement captured the system while relatively little glucose was entering the bloodstream from food.
The glucose challenge asked the system to handle a much larger load.
That is a different test.
Post-meal glucose shows how you handle a challenge
After you eat carbohydrates, they are broken down into glucose and other sugars that enter the bloodstream.
The pancreas responds by releasing insulin.
Insulin helps move glucose out of the bloodstream and into tissues where it can be used or stored.
In a metabolically healthy system, glucose rises after eating and then moves back toward baseline as the body handles the incoming fuel.
But when glucose regulation becomes impaired, the pattern may change.
Glucose may:
- rise higher
- stay elevated longer
- take more insulin to control
- or show greater variability from meal to meal
A standardized oral glucose tolerance test (OGTT) takes advantage of this deliberately.
After an overnight fast, the person drinks a solution containing 75 grams of glucose.
Blood glucose is then measured again, commonly at two hours.
Current ADA diagnostic ranges for that two-hour value are:
| 2-hour OGTT glucose | Interpretation |
|---|---|
| Below 140 mg/dL | Below impaired-glucose-tolerance range |
| 140–199 mg/dL | Prediabetes / impaired glucose tolerance |
| 200 mg/dL or higher | Diabetes range when appropriately confirmed |
And here is a particularly important point:
The ADA notes that the 2-hour glucose value identifies more people with prediabetes and diabetes than fasting glucose or A1C at their respective diagnostic cutoffs.
In other words, some glucose problems become more obvious only when the body is actually challenged with glucose.
A normal fasting number does not necessarily mean every meal response is normal
This is one reason clinicians investigating early metabolic dysfunction may look beyond fasting glucose and A1C, using glucose-tolerance testing or, in selected circumstances, continuous glucose monitoring to see what happens to glucose over time rather than relying on static measurements alone.
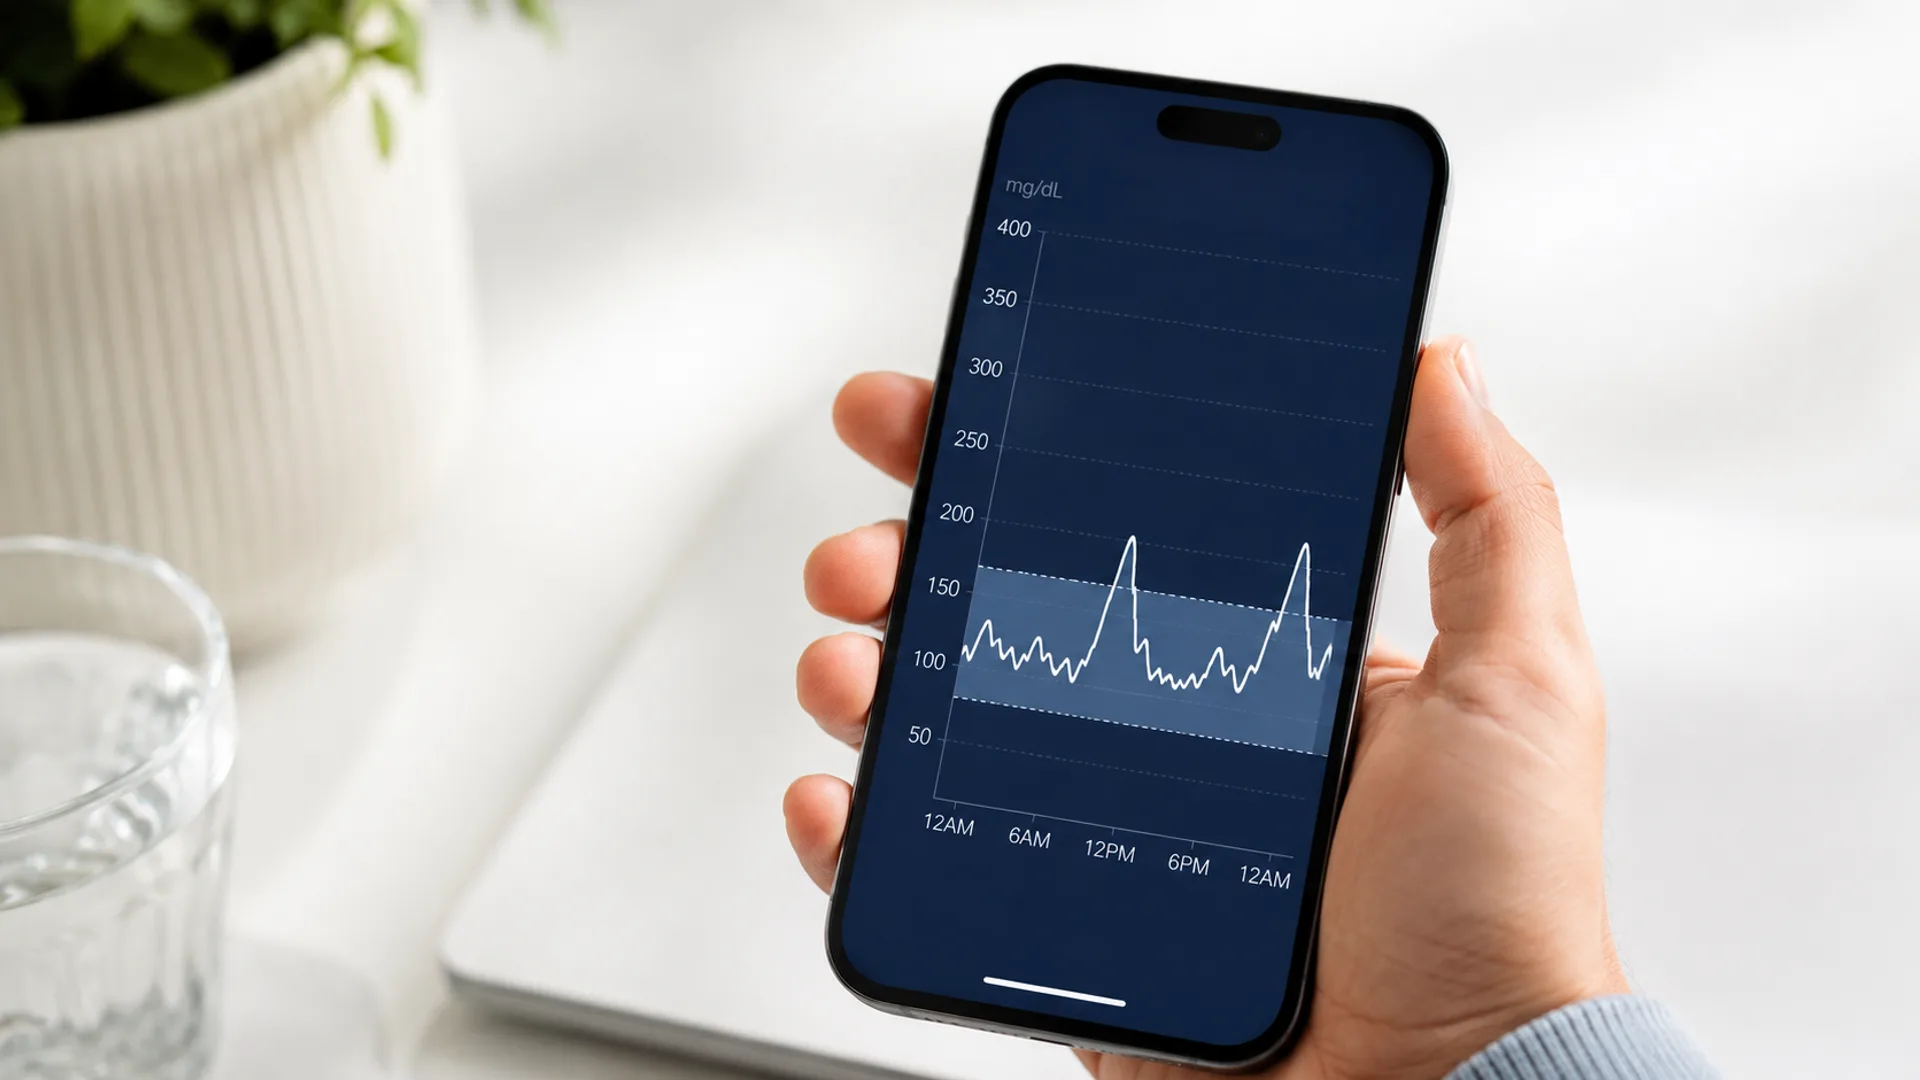
CGMs can show things a fasting glucose measurement simply cannot:
- how high glucose rises after a meal
- how long it stays elevated
- how much glucose fluctuates throughout the day
- how different meals affect the same person
- how sleep, exercise and meal timing may change the response
That doesn't mean everyone needs a CGM.
It means the information is different.
A morning fasting value is a photograph.
A CGM is closer to a movie.
But ordinary meals aren't the same as an OGTT
This distinction matters.
A two-hour glucose value during a laboratory OGTT has established diagnostic thresholds.
Checking glucose two hours after your dinner at home is not the same diagnostic test.
Meals differ tremendously in:
- carbohydrate amount
- carbohydrate type
- fiber
- protein
- fat
- portion size
- food order
Your glucose response can also change depending on:
- exercise
- sleep
- stress
- previous meals
- time of day
- medications
So a single post-meal reading after pizza or pasta should not be used to diagnose yourself with diabetes.
What matters more is the pattern, interpreted in the right clinical context.
Why your A1C and fasting glucose can disagree
Suppose your fasting glucose has recently started climbing.
Your A1C may still look relatively good because A1C reflects months of glucose exposure, with more recent weeks only gradually influencing the result.
The opposite can happen too.
Your fasting glucose may improve relatively quickly after lifestyle or medication changes while the A1C still reflects weeks of higher glucose from before those changes.
There can also be biological reasons for discrepancies.
Because A1C depends on red blood cells and hemoglobin, conditions that alter red-cell lifespan or hemoglobin can make A1C less representative of actual glucose exposure.
That's why persistent disagreement between A1C and glucose measurements is worth investigating rather than simply assuming one test must be wrong.
Get the research, without the noise.
Practical, sourced writing on blood sugar and metabolic health. One email a week.
One email a week. Unsubscribe any time. See our privacy policy.
The numbers can also reveal where the problem is showing up
Very broadly, abnormal glucose can appear in different ways.
Pattern 1: Higher fasting glucose
This may reflect problems with overnight glucose regulation, including excessive glucose production by the liver and reduced ability of insulin to suppress that output.
Pattern 2: Normal fasting glucose, higher post-challenge glucose
The system may look relatively normal at rest but have more difficulty disposing of glucose when a larger amount arrives.
Pattern 3: Both are elevated
Glucose regulation may be impaired both while fasting and after a glucose challenge.
Pattern 4: A1C is elevated while individual readings seem lower
This may simply mean you're missing periods of higher glucose — or it may warrant investigation of factors that can affect A1C itself.
These are patterns, not diagnoses.
But they show why reducing metabolic health to a single number can be misleading.
The Health Facts takeaway
The easiest way to understand the three measurements is this:
A1C is your semester grade.
Fasting glucose is what your body is doing first thing in the morning.
Post-meal glucose is closer to a stress test.
One tells you the average.
One tells you how the system behaves without incoming food.
One tells you what happens when fuel arrives.
And for metabolic health, the bigger goal isn't simply to produce one "good" number on one particular morning.
It's to build a system that can handle different situations well:
eating → storing fuel → using fuel → fasting → moving → eating again.
That ability to respond appropriately as conditions change is part of what researchers call metabolic flexibility.
A metabolically healthy body shouldn't only look good when nothing is happening.
Ideally, it should also be able to handle the challenge when something does.
Sources
- 1. Diagnosis and Classification of Diabetes: Standards of Care in Diabetes—2026. Diabetes Care (American Diabetes Association), 2026. doi:10.2337/dc26-S002
- 2. Diabetes & Prediabetes Tests. National Institute of Diabetes and Digestive and Kidney Diseases.
- 3. Insulin Resistance & Prediabetes. National Institute of Diabetes and Digestive and Kidney Diseases.
Comments
No comments yet.
Leave a comment
Comments are moderated. Be kind and stay on topic.